

Tapping into Dark Data
Recent advancements in NLP and language AI technologies have shed light on just how much of our data remains unseen and unanalyzed. Traditional customer service analyses, for example, relied on self-reported user satisfaction ratings or manual review of potential problems by managers. We’ve written on this concept of ‘dark data’ before, where the majority of your data hasn’t even been taken into account when performing an analysis; knowing the rating a customer gave a chatbot experience may be an interesting stat in aggregate, but if you don't know what factors drive that score, relationships between frustration and topics discussed, which topics are easier/quicker to resolve by humans, or what your automation opportunities are - you are leaving the most important parts of your data untapped. You can read more about dark data in a previous blog post here.
To shed light on dark data, Dashbot gives you easy to understand breakdowns of your aggregate data before jumping into more advanced insights. One of the first examples of our data enrichment process is showing you the entire distribution of your data by what your users are talking about:
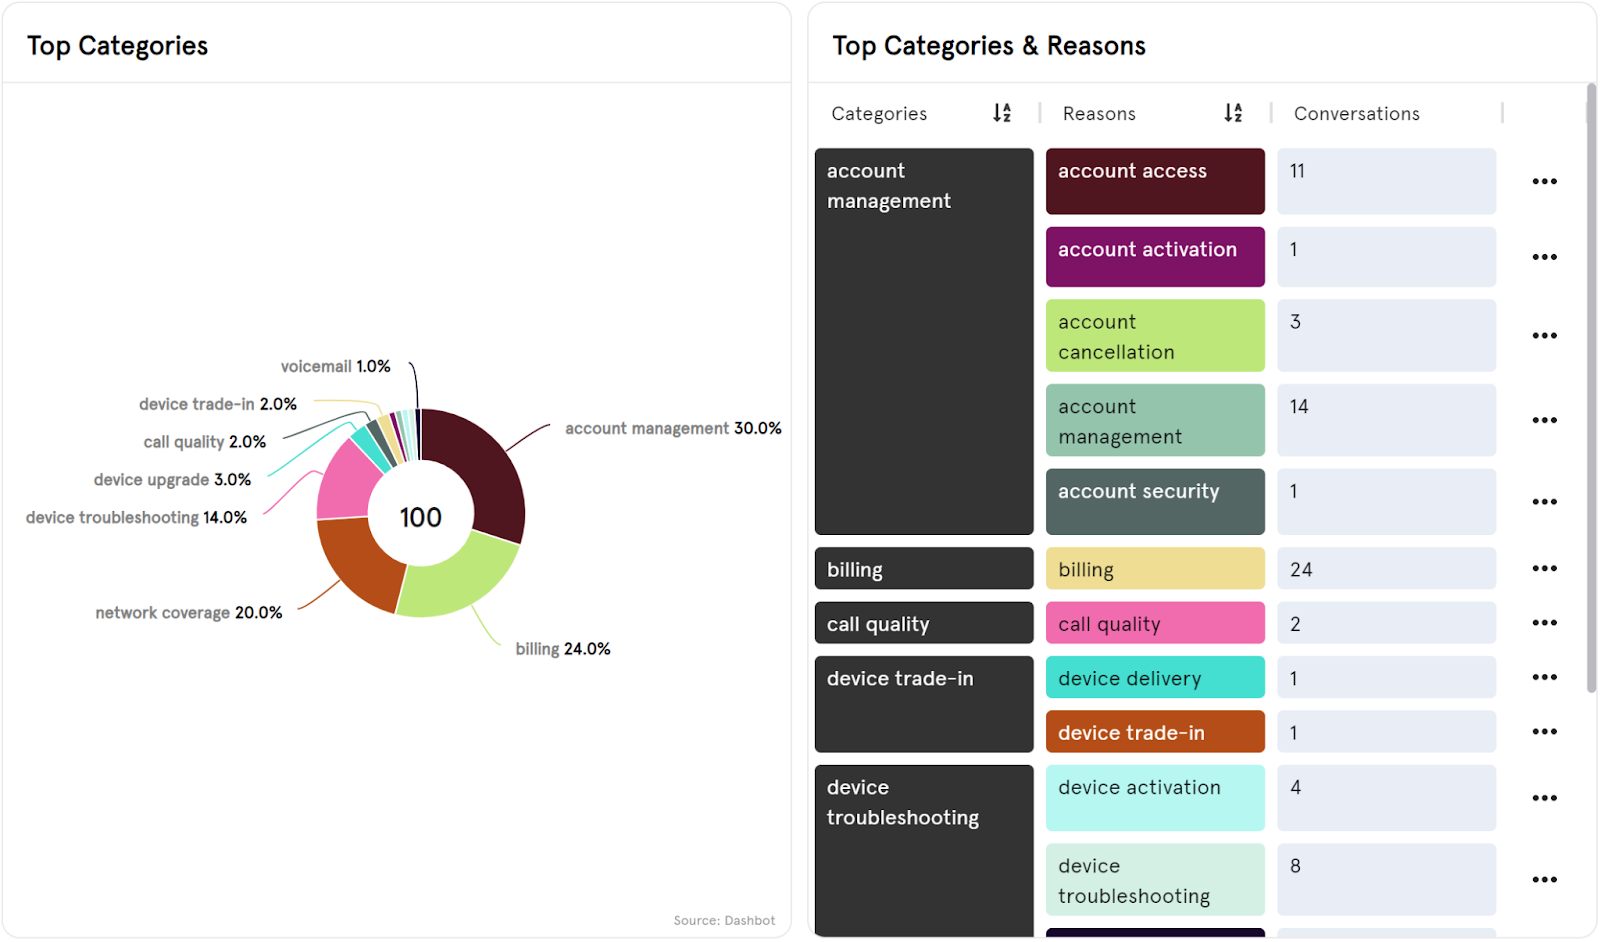
In the above screenshot none of the information displayed, aside from the number of conversations, existed in the source data. The high level categories of conversation are shown and then broken down into the more specific ‘reasons’ a user engaged with your platform. These were all produced by Dashbot technologies in order to better visualize the scope of your data.
Dark Data isn’t the only major obstacle to comprehensible conversational data analysis; traditional data warehousing and analysis tools like PowerBI, Tableau, or even the old reliable Microsoft Excel do not inherently add value to your existing data. Storing data and extracting information from that data, such as the time to resolution of various customer service items, is merely the first step. However, it relies on basic data collection and processing results in basic data analysis and insights. However good your data science team is, they are limited by the architecture of their tools.
Data Enrichment in Dashbot
To move beyond the heavily constrained data processing and analytics of today, ‘data enrichment’ is required. This means transforming or adding new value to your data that did not previously exist: imagine that you have transcripts of all of your chatbot or live agent interactions and are looking for insights. Dashbot can produce an effort score for every single conversation you have; i.e. how much effort did the customer have to put into their engagement with your platform before either having their query resolve or fail to resolve? Another basic example is predicting user satisfaction with Large Language Models:
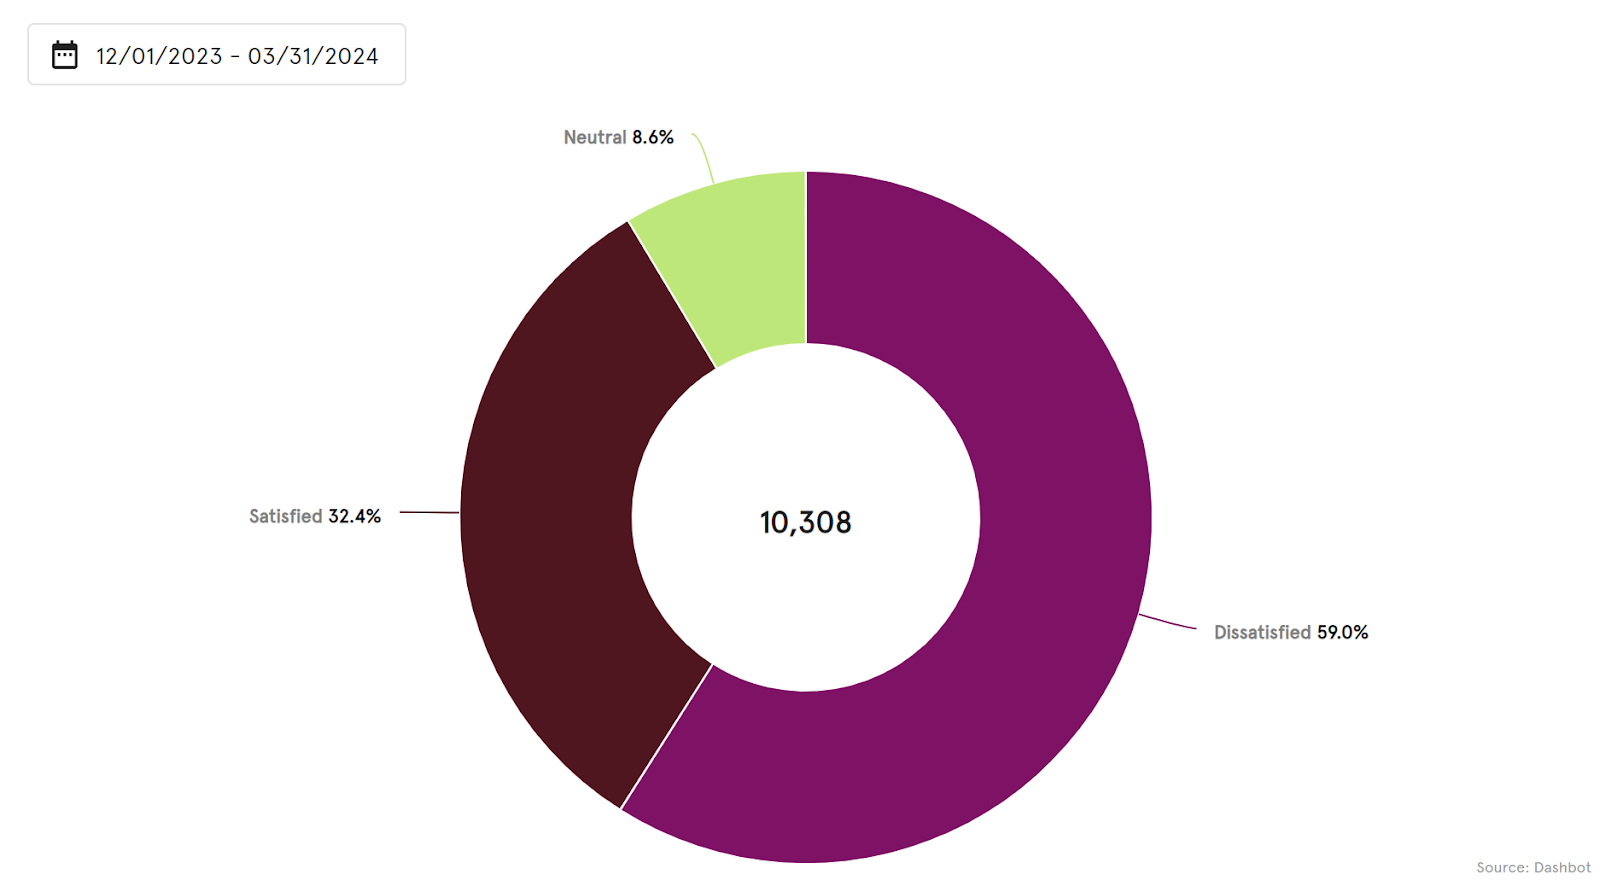
Dashbot can produce these types of insights not only for metrics that we define and present because we think they add value, but also for insights that you’d normally want already but only get from customer surveys; when you create your CSAT score the traditional way, for example by counting the (very) satisfied customers against the rest of your survey respondents - that number is only reflective of your respondents.
That’s why Dashbot produces these insights across the entire scope of your data with our proprietary LLM pipeline:
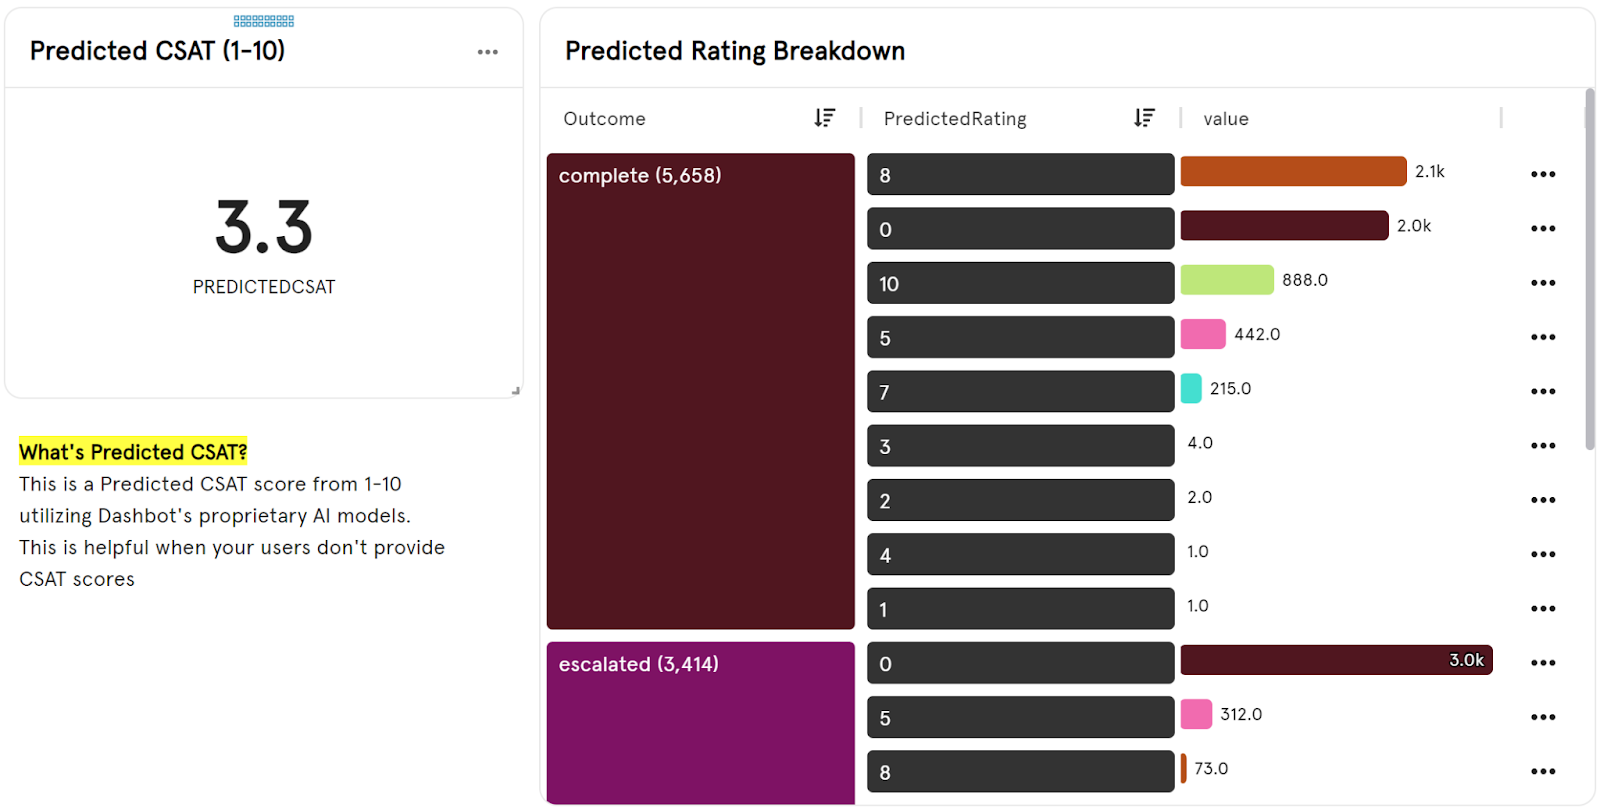
In the above image, you can see the Predicted CSAT across your entire dataset as well as the spread of ratings across your data, broken down by outcome (complete: query resolved, escalated: user asked to speak to human). This helps you understand your data better; for example, escalated conversations have a massively disproportionate skew to a 0 rating, but you also have many completed conversations being given a 0 score. Every single insight you see with Dashbot can be broken down and analyzed to uncover the "Why?" behind your insights. If you are curious about why users are still giving 0 scores in completed conversations, you can examine that segment of your data further.
The Value of Comparison
Since every element of data enrichment Dashbot provides is a dimension by which you can organize and view your data, our dashboards and tools are highly flexible and customizable. ‘Effort’ is similar to CSAT, except that it focuses on the amount of friction in a customer interaction. We don’t just throw an aggregate effort score onto your dashboard and wish you good luck; even our basic data breakdowns help you understand the spread of your data:
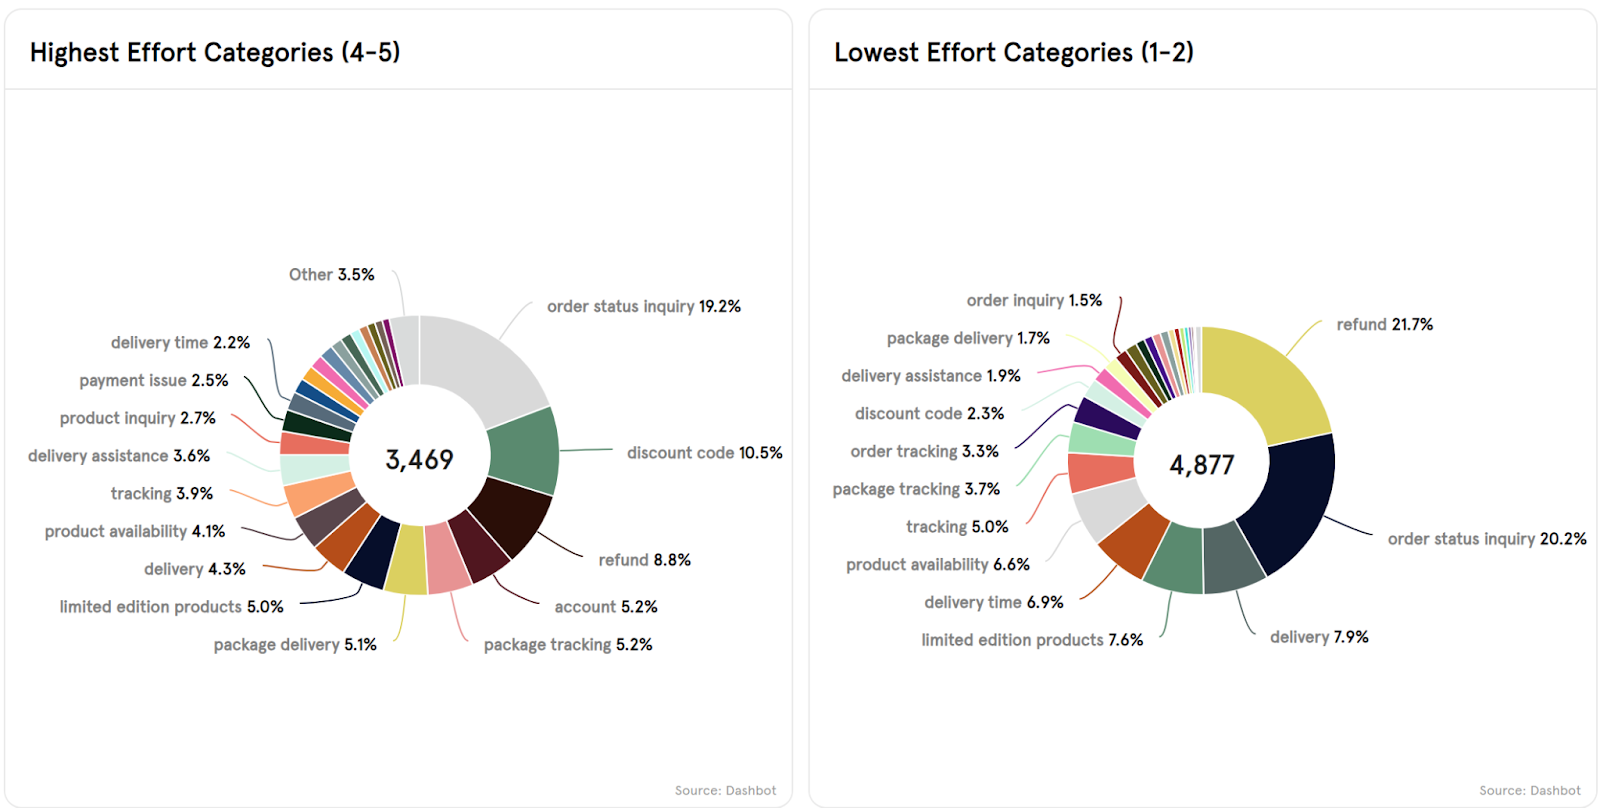
Above you see the difference in the spread of categories of things discussed in your conversational data - knowing where your users, chatbot, or live agents struggle most or shine brightest helps you determine where to prioritize improving your platform or what potential automation opportunities are.
Advanced Analytics
Dashbot understands the importance of holding your hand; endless insights and statistics don’t help you make your product better - clearly actionable insights do. That’s why Dashbot doesn’t just offer high precision data exploration tools like our Data Slicer, but also dashboards which view your data through the lens of actionability.
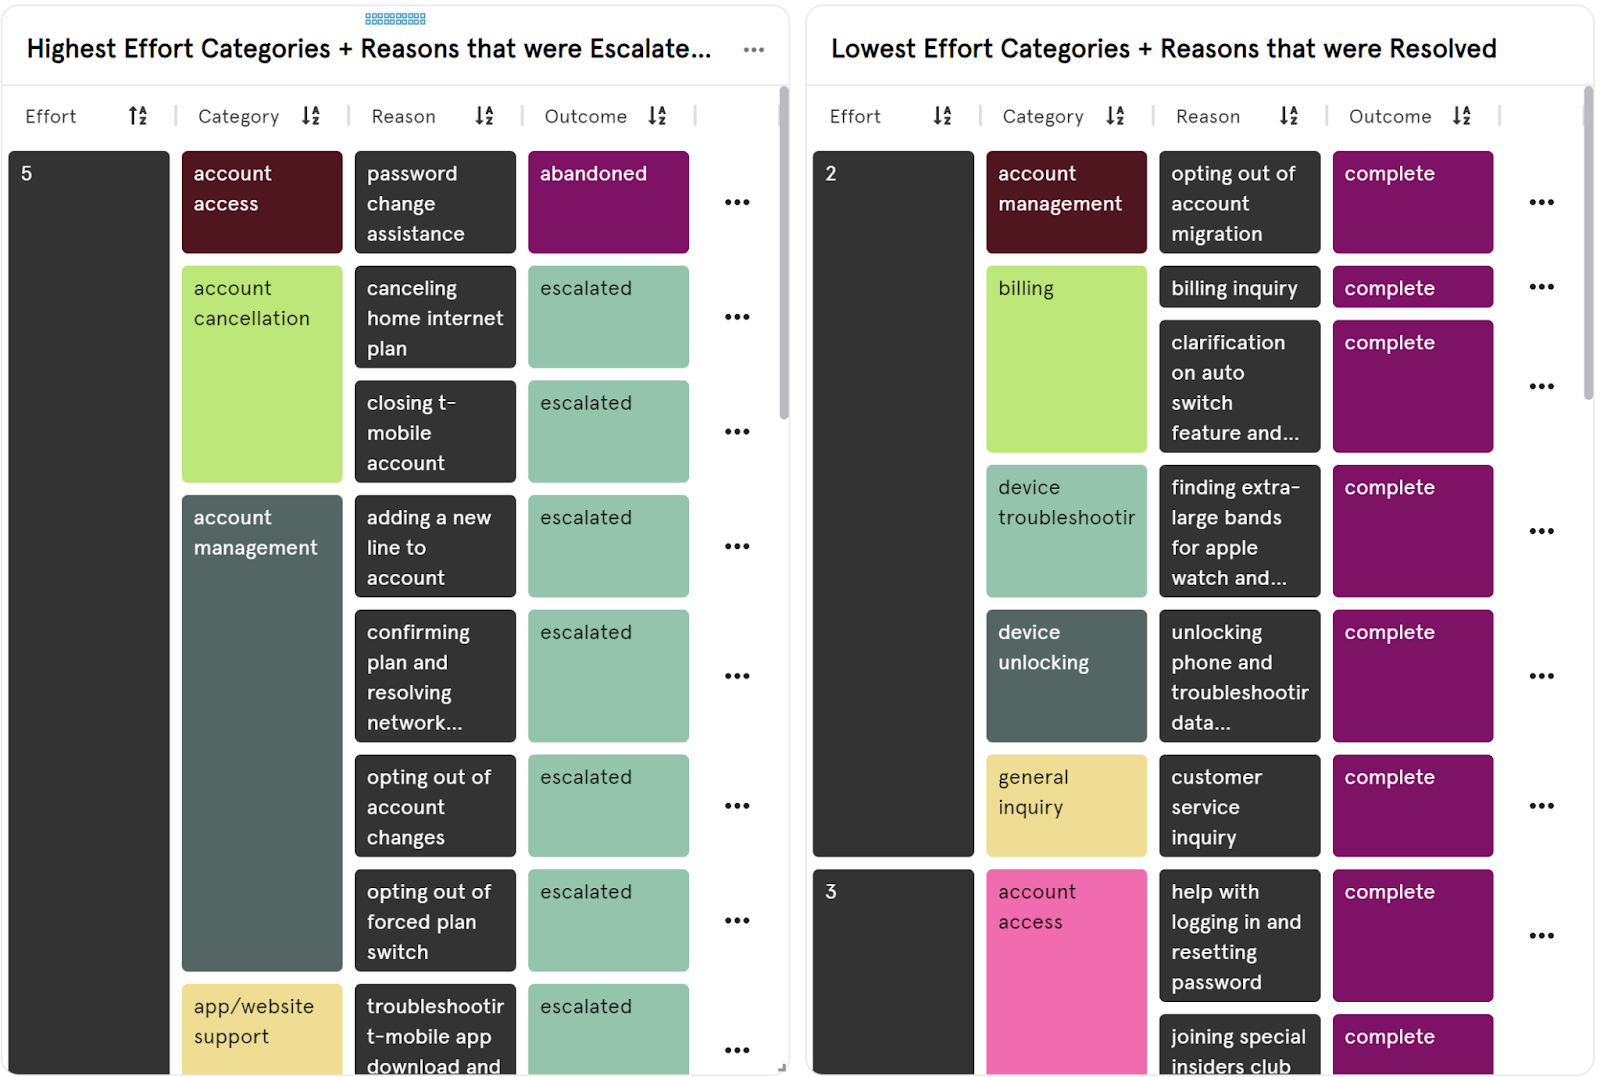
Above: Here is an example of Dashbot guiding you towards automation opportunities. Not only do we enrich your data with new dimensions like effort, high level category of discussion, reasons the user engaged, and whether the conversation was resolved, abandoned, or escalated - use these dimensions to organize your data into a call for action: your highest effort categories/reasons which were escalated to a(nother) human are likely not ideal opportunities for automation as your system is failing. But if you have live agents handling low effort categories/reasons which are resolved - those are more likely candidates for a traditional bot or LLM to handle; taking the load off your live agent cohort.
Conclusions: The Differentiating Factor
Dashbot takes industry tested metrics like CSAT and our own custom metrics and dimensions to transform your data into a knowable, navigable library of actionable information. These data enrichment strategies leverage new technologies that depart from aging approaches to language analysis; traditional ML topic modeling for example is too inflexible, whereas our LLM pipeline understands your data. We don't just show what your users are talking about, but why they are speaking in the first place, where they are most frustrated, and where your automation opportunities lie.
Platforms like Tableau use tools which, in their own words, “describe[s] relationships in your data. It can't tell you what is causing the relationships or how to interpret the data.” That’s true, and it’s an unfortunate limitation on top of the work you have to do to squeeze value out of unenriched data sources. Our tools leverage state of the art LLM abilities to get closer to explaining causality and give you more exact calls to action. They claim that “you are the expert on your data.” - except, you aren’t. But you could be; sign up for a demo with Dashbot today to learn how.


